Finance → Profitability → Revenue Movement shows how your monthly recurring revenue moved from one month to the next. It answers "our recurring base moved — which agreements moved it?" and turns "we lost $4k of recurring revenue" into two names and two amounts.
What is on the tab#
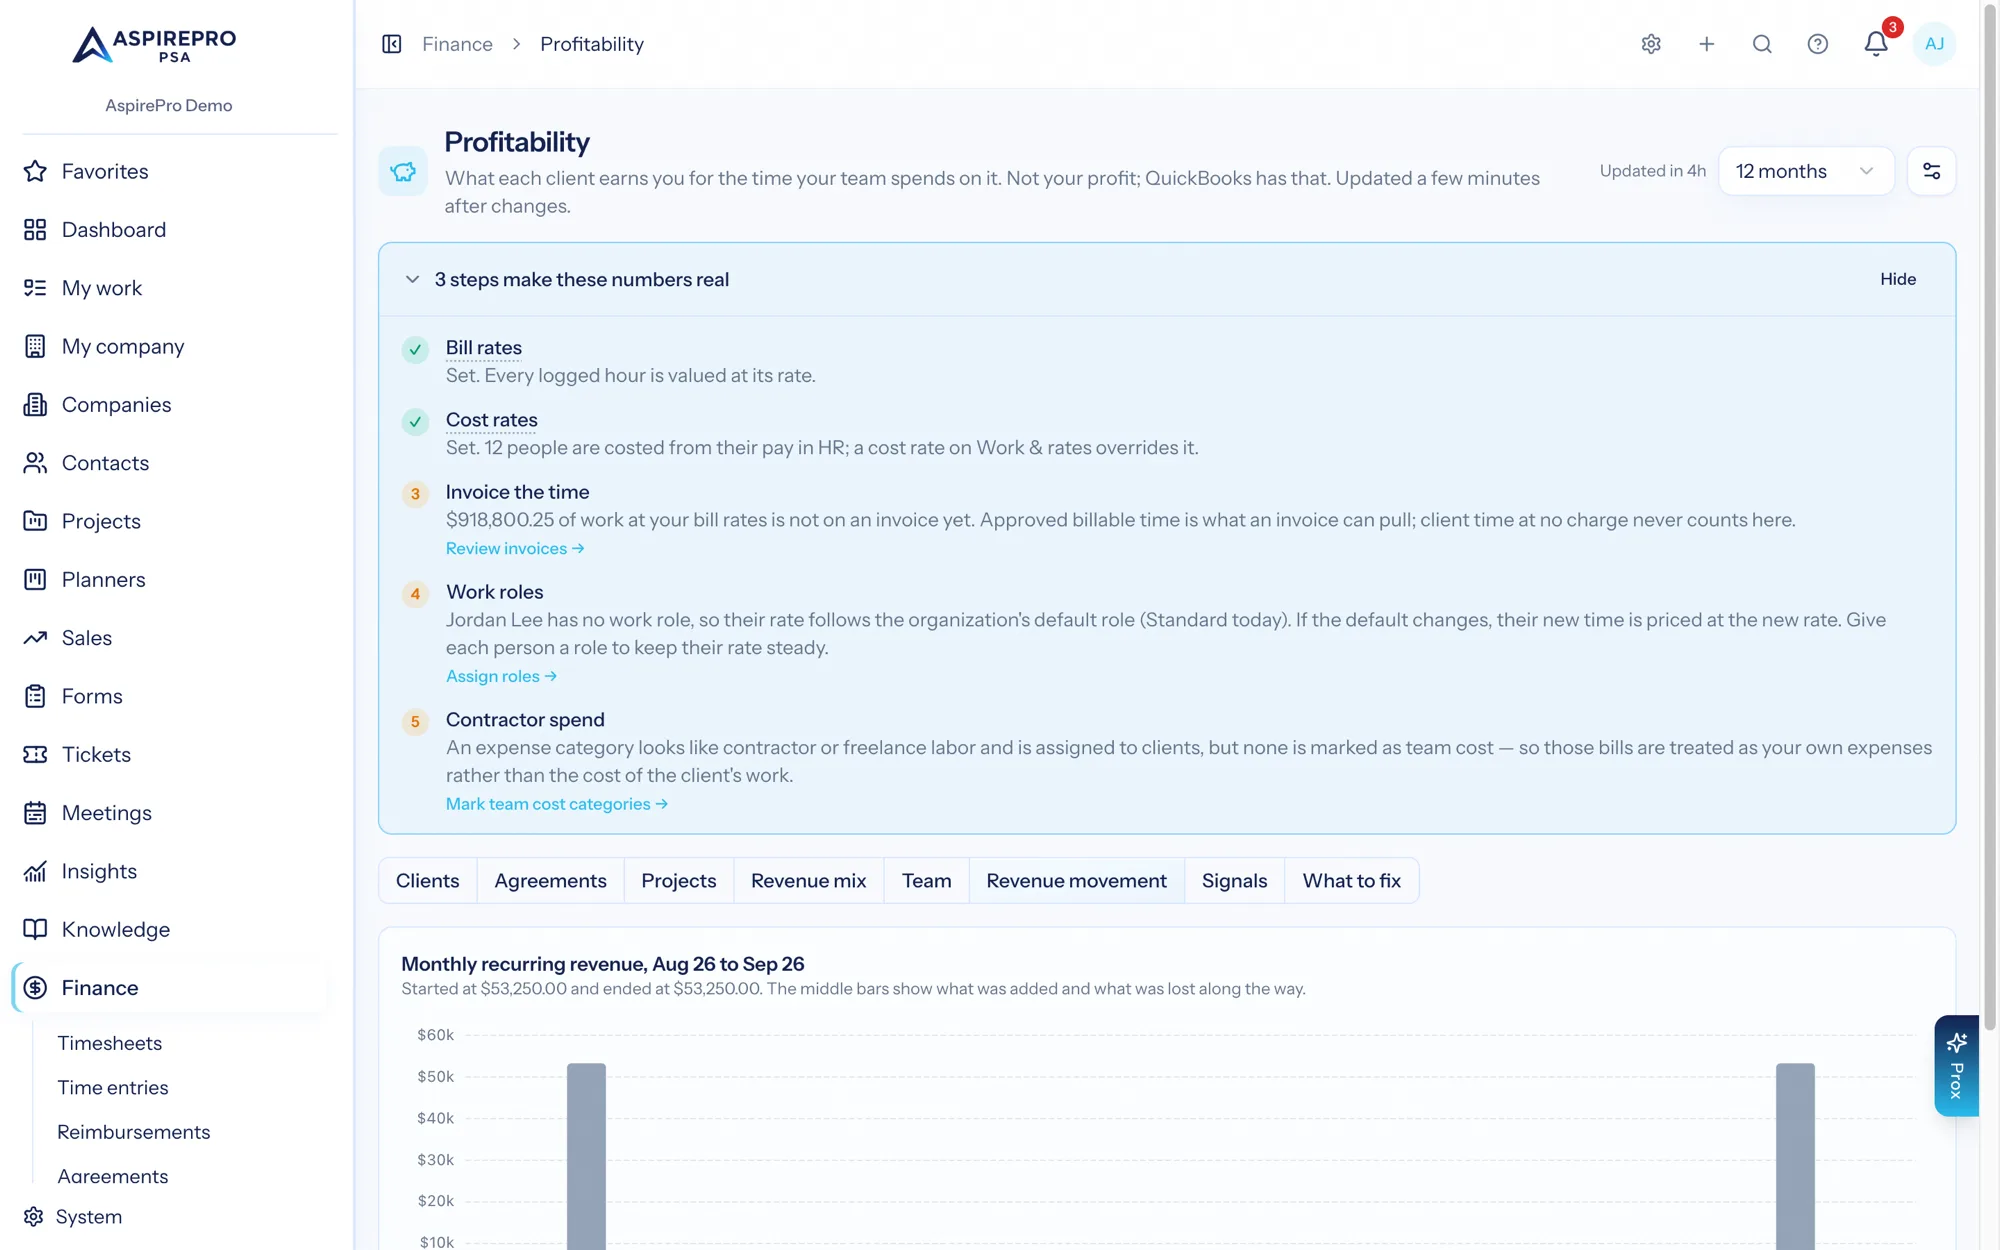
At the top sits a chart titled Monthly recurring revenue, to (the month before last to the last completed month), captioned "Started at $X and ended at $Y. The middle bars show what was added and what was lost along the way." When neither month has any recurring revenue it reads "No recurring-revenue figures for these months yet." Below it are four cards, New, Growth, Decline and Lost, each with its total at the top right (green when positive, red when negative) and the agreements behind it listed underneath, always open. A card with nothing in it reads "Nothing here this month."
The calculation#
opening + new + growth − decline − lost = closing- Opening — total monthly recurring revenue across the month before the last completed one.
- Closing — total monthly recurring revenue across the last completed month.
- The four buckets in between account for every dollar of the difference, agreement by agreement.
The four bucket rules#
Each bucket is decided per agreement, comparing the two months' recurring values:
- New — the agreement had recurring revenue in the closing month and none in the opening month. A brand-new contract, or one that came back.
- Growth — recurring revenue in both months, and it went up by more than $0.01.
- Decline — recurring revenue in both months, and it went down by more than $0.01.
- Lost — the agreement had recurring revenue in the opening month and none in the closing one.
The one-cent limit exists so a rounding difference on a repriced agreement is not reported as growth. Movement of exactly a cent or less is treated as no movement.
Every bucket is a card that is always expanded: the agreements behind it are listed on it, each with its client (linking to the client report) and its change, sorted by size. There is nothing to open. Agreements deleted since are still resolved by name, because the history outlives the paper.
It always reads the last completed month#
Revenue Movement ignores the 3/6/12/24-month period selector. It is always the last completed month against the month before it, for one reason: the current month is still in progress, agreements are still being signed and cancelled inside it, and a chart drawn across a half-finished month reports churn that has not happened.
Signals do the same. Every other tab honours the period.
Which agreements can never appear#
Monthly recurring revenue comes from each month's agreement snapshot — the population as it stood at the time — and an agreement is only in the chart if that snapshot recorded a positive recurring value. So an agreement is invisible here when:
- It is excluded from financials.
- Its recurring value is null or zero or negative — which is every time-and-materials agreement, since a T&M contract has no recurring amount by definition.
- Its month was never snapshotted, so there is no population to read. See Freshness and history.
That last case is worth watching after a history rebuild: a month with no snapshot contributes no recurring revenue at all, and a chart drawn across it will report the whole base as lost and then as new.
Because monthly recurring revenue is a per-cycle amount converted to a monthly figure, a quarterly $9,000 agreement carries $3,000 of monthly value every month, including the two months it does not invoice. The chart is about the contractual base, not about cash. How monthly value is derived →
Worked example — one month's movement#
June 2026 (the last completed month) against May 2026. Five agreements moved.
Opening (May)                                       $61,200.00

New
  Harbor Digital — Care Plan                        +$1,500.00
Growth
  Rivera Monthly Retainer   $5,250 → $6,000           +$750.00
  Northwind Retainer        $4,200 → $4,500           +$300.00
Decline
  Castellan Support         $3,520 → $2,992           −$528.00
Lost
  Pemberton Hosting         $2,400 → none           −$2,400.00

Closing (June)                                      $60,822.00
Check it by hand:
$61,200.00 + $1,500.00 + $1,050.00 − $528.00 − $2,400.00 = $60,822.00The bucket totals the tab prints are New $1,500.00, Growth $1,050.00, Decline −$528.00, Lost −$2,400.00, a net movement of −$378.00.
Read across it: the base shrank by $378, but that is two healthy expansions offset by one client cutting back and one leaving outright. Castellan is the one to act on — its monthly recurring revenue also fell 12% into May, so this is its second month down in a row and the Signals tab raises it under At risk with the same numbers.
Pair this with the at risk badge on the Agreements tab. This chart tells you what already moved; the badge tells you which recurring revenue is sitting on an expired agreement and is about to.