Insights ships with dozens of metrics spanning every module, and each is designed so the numbers are always accurate and secure — you only ever see what you're allowed to.
What you can measure#
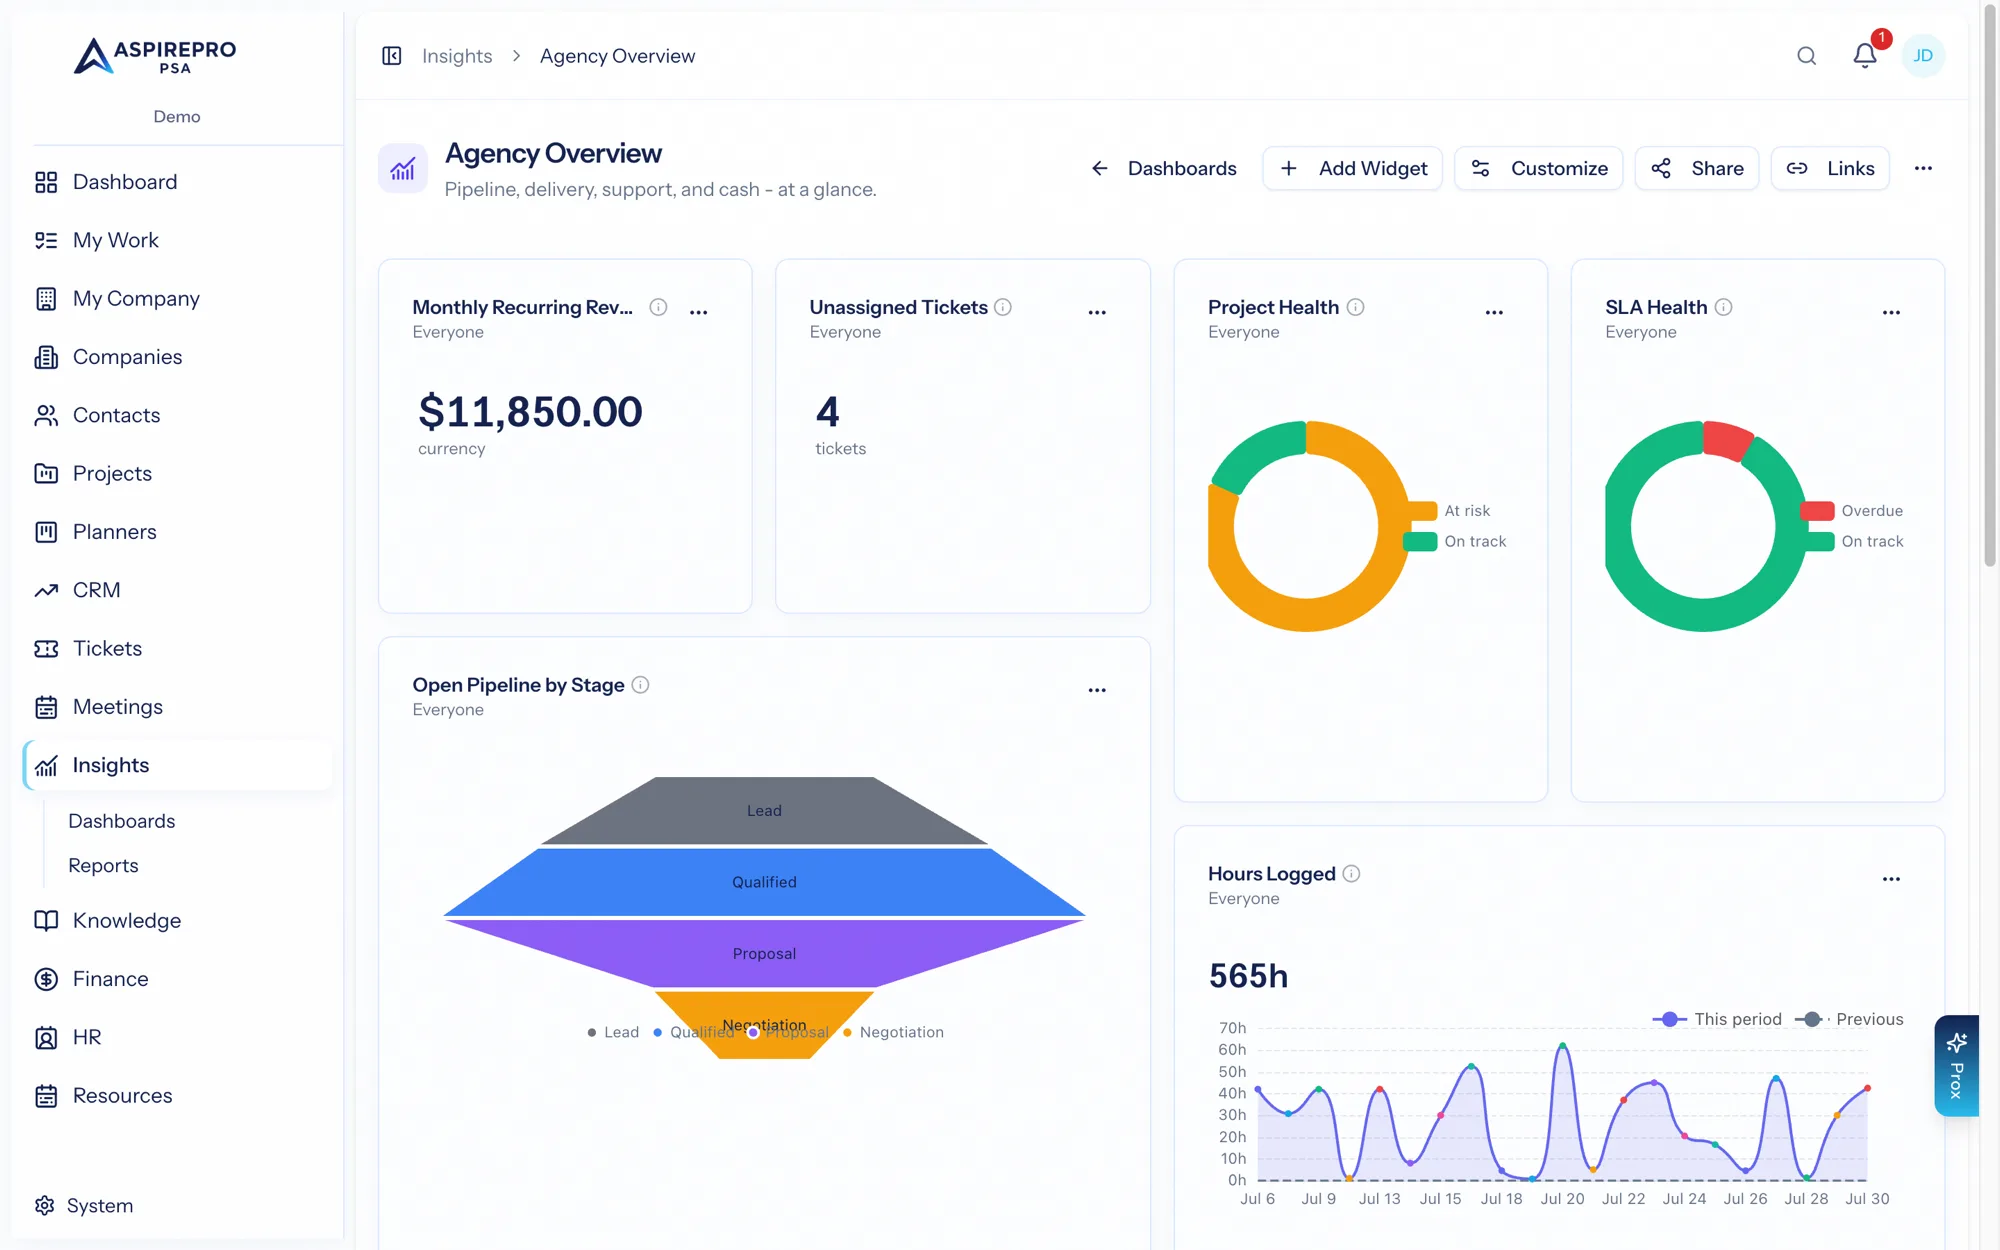
Metrics are grouped by area. A sampling of what's available:
- Tickets — open by board, by priority, by client; throughput, backlog, aging, unassigned, response times; and CSAT (overall, by board, by agent, by team).
- CRM — deals by status and stage, created, won/lost, average deal size, sales cycle, activities, deals by source, email engagement, and the outbound set: dials per day, connect rate (or reply rate, by picking the Email type), and calls by outcome.
- Lists — for outbound blocks: the call block funnel (members → reached → calls & emails → conversations → meetings → opportunities → won), meetings per 100 touches by block, and a live view of every open block and where it stands.
- Projects — budget vs. actual, overdue tasks, on-time rate, project health, phase progress.
- Time — hours logged (by person, by role), utilization, billable split, and Unbilled WIP (approved billable time not yet invoiced — the same pool an invoice pulls from; its note says how much billable time is still waiting for timesheet approval).
- Finance — Invoiced Revenue and Invoiced Minus Expenses (both before sales tax, the figure Profitability counts; the second is directional, not profit), recurring revenue, MRR movement, renewals due, collection rate, days sales outstanding, outstanding invoices, and four from Profitability that all read the nightly rollups through the same calculator as the page: Return on Time by Client, Return on Time by Agreement, Effective Rate (by agreement or by client, weighted by hours) and Billing Efficiency (labor invoiced ÷ the value of the work at bill rates, by client or agreement — the one that needs no cost rates). The former Effective Hourly Rate widget, which was invoiced-only and reported an uninvoiced client at $0/hour, was retired; saved copies now show Effective Rate by client.
- Clients — Client Health (latest score per client, lowest first) and Client Health Over Time (average per day from the nightly snapshots) — both only while client health is switched on under System → Lifecycle; an existing widget shows "This metric is no longer available to you." when it is off — plus Services Sold by Client, Lifecycle Compliance by Client, Lifecycle Goals Needing Attention, Estimated Expansion Value (the list-price value of the services a client does not buy yet — an estimate, not pipeline), CSAT by client, revenue/hours/tasks/tickets by client, and share of work by client — the same number as the Work column on Profitability, so a widget and that page never disagree.
- Lifecycle — Lifecycle Goals by Status (every open and closed goal period grouped by status) and Lifecycle Goals Due Soon (open goals closing within 30 days). See Lifecycle.
- HR — certifications expiring, goals progress, reviews outstanding, upcoming time off.
- Team & personal — login activity, and your own work (open items, sessions today, blocked work).
Which metrics you can add depends on the modules you have enabled and your permissions.
Prebuilt dashboard templates assemble a themed set in one click — including Outbound, which pairs dials per day and connect and reply rates with what happened on each touch and where every block stands.
Every metric drills to records#
Metrics aren't just numbers — every one can drill down to the actual records behind it. Drilling shows the underlying tickets, deals, invoices, or tasks with deep links to open them, plus a quick breakdown by status or person. So a number on a dashboard is always one click from the specifics.
How scoping stays secure#
Insights enforces three invariants so a dashboard can be shared freely without ever leaking data:
- Permission is checked twice — both when a metric is offered in the picker and when it runs. A widget can never outlive the permission that created it; lose access to the underlying data and the widget stops showing it.
- Scope re-derives from the viewer — a widget never carries a fixed scope. When you open (or drill into) a shared dashboard, the numbers are computed for your access. Two people can open the same dashboard and correctly see different figures.
- Caches are scoped — cached results are keyed to the viewer's permission identity, so a lower-privileged viewer can never be served a higher-privileged person's cached numbers.
Together these mean you can build a dashboard once and share it with anyone: each person sees the same widgets, scoped safely to what they are allowed to see.
This is what makes Insights safe to share widely: the dashboard defines the questions, and every viewer gets their honest answer — never more than their permissions allow.