Resource Management includes reports that turn the raw capacity picture into the numbers a services business runs on — utilization, bench, and how estimates compare to reality. Find them under Resources → Reports.
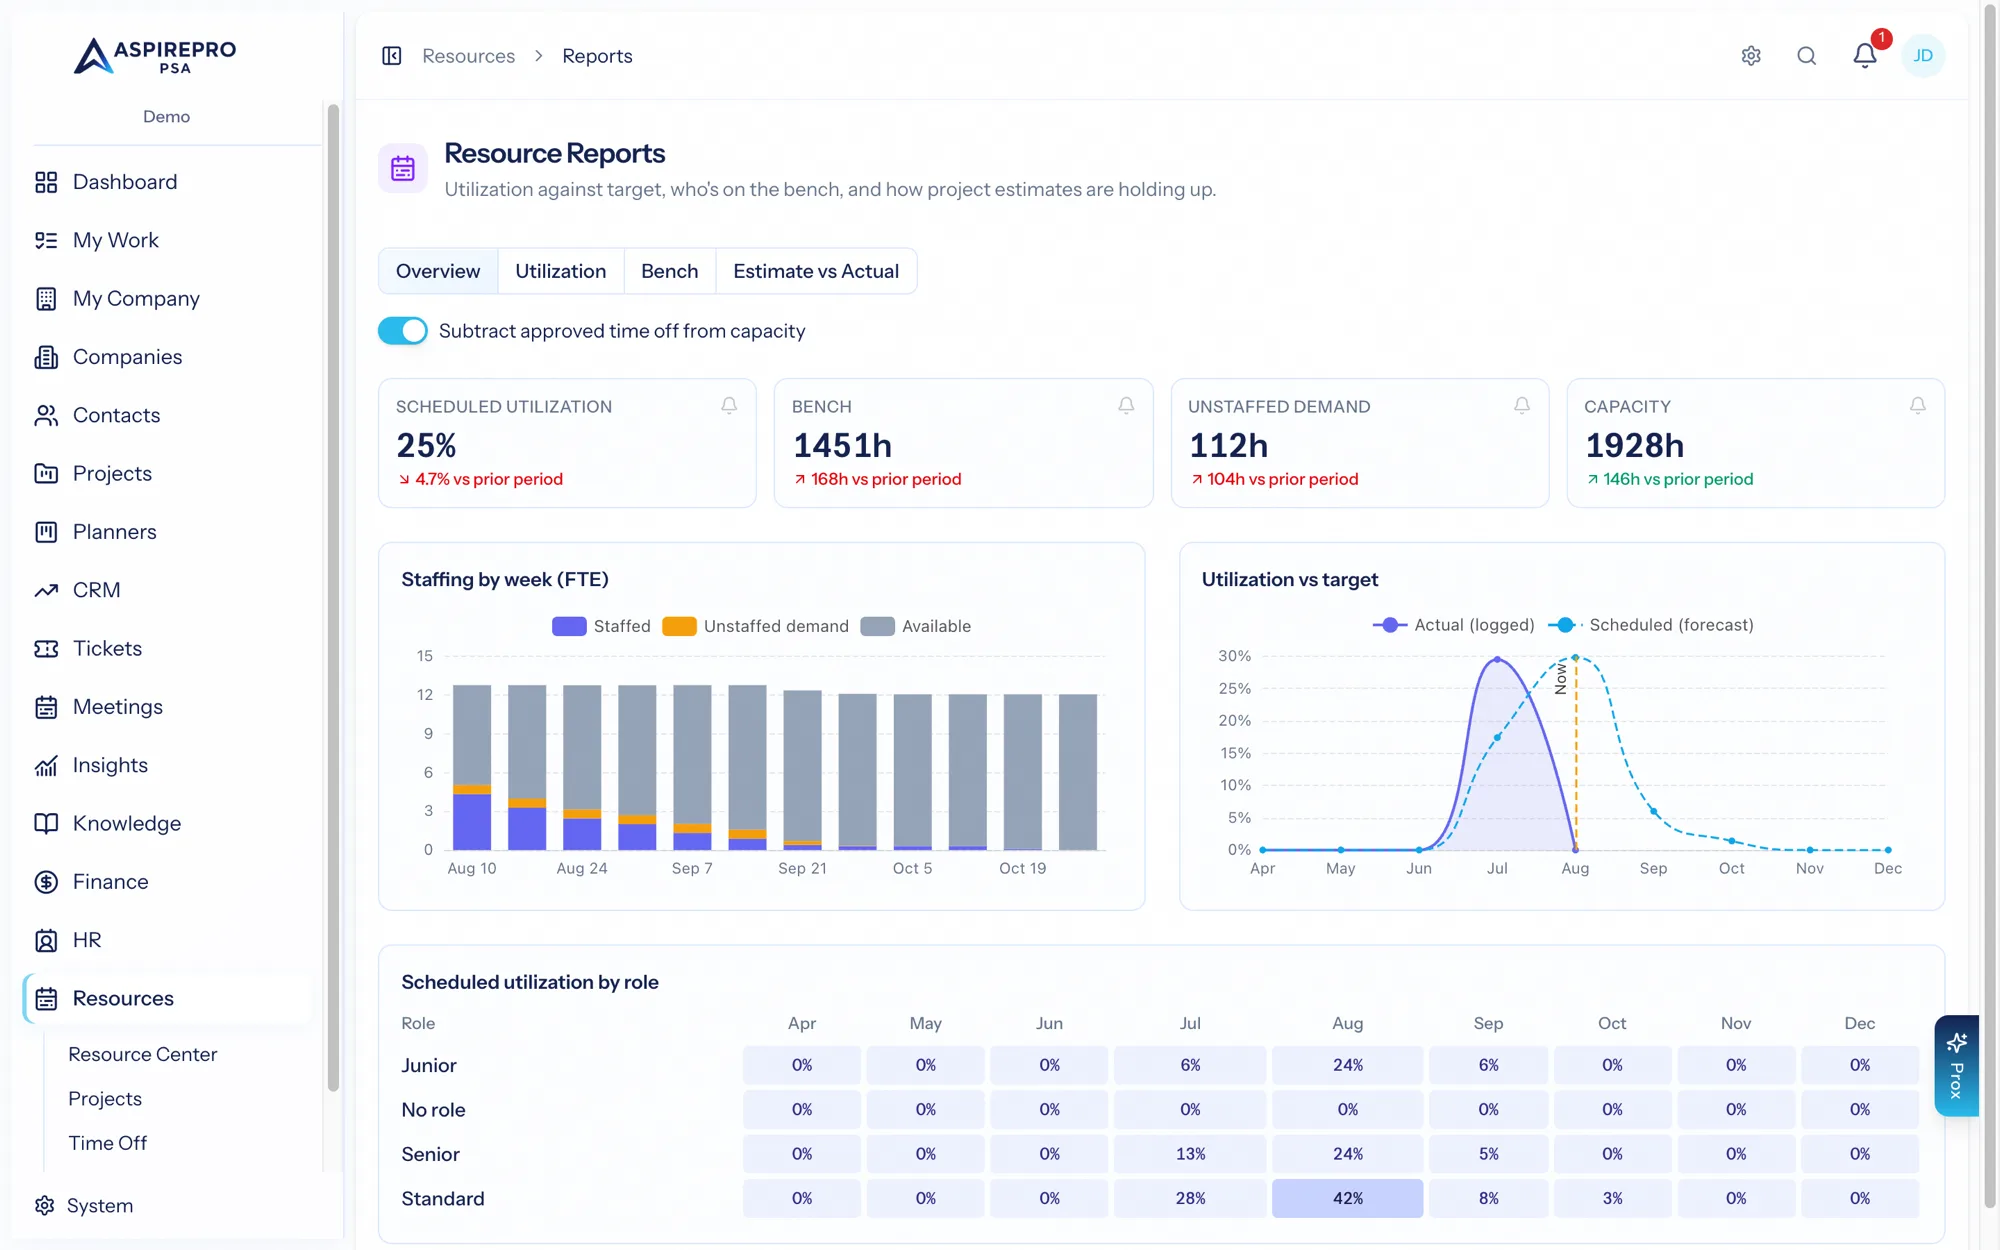
Overview & forecast#
The Overview leads with headline KPIs — scheduled utilization, bench hours, unstaffed demand, and total capacity — each with a delta versus the prior period, so you see the trend, not just the number. Below, it forecasts full-time equivalents by week (staffed, unstaffed, and available), plots utilization by month against your target (actuals then forecast), and breaks capacity down by work role over time. A toggle lets you subtract time off from the picture.
Utilization#
The Utilization report shows, per person, their scheduled utilization (allocated ÷ capacity) and actual utilization (logged ÷ capacity) against your target, plus their billable percentage. Choose a 4-, 8-, or 12-week lookback. It's the report to answer "are we busy, and are we busy on the right (billable) things?"
Bench#
The Bench report lists who has unallocated capacity over the coming weeks, most-available first — your at-a-glance answer to "who could take on more?"
Estimate vs. Actual#
The Estimate vs. Actual report compares, per active project, the hours estimated, the hours allocated (planned), and the hours logged (actual), with the variance and burn percentage. It's how you catch a project drifting over budget while there's still time to act.
KPI alerts#
Set KPI alerts to be notified when a metric crosses a line — for example, when scheduled utilization drops below a threshold or unstaffed demand climbs above one. Each alert watches one of the Overview metrics for a person, in a chosen direction, so the numbers come to you instead of you having to check.
These reports connect planning to reality: allocations set the plan, timesheets record what happened, and Estimate vs. Actual plus Utilization show you where the two diverge — the feedback loop that makes the next plan better.