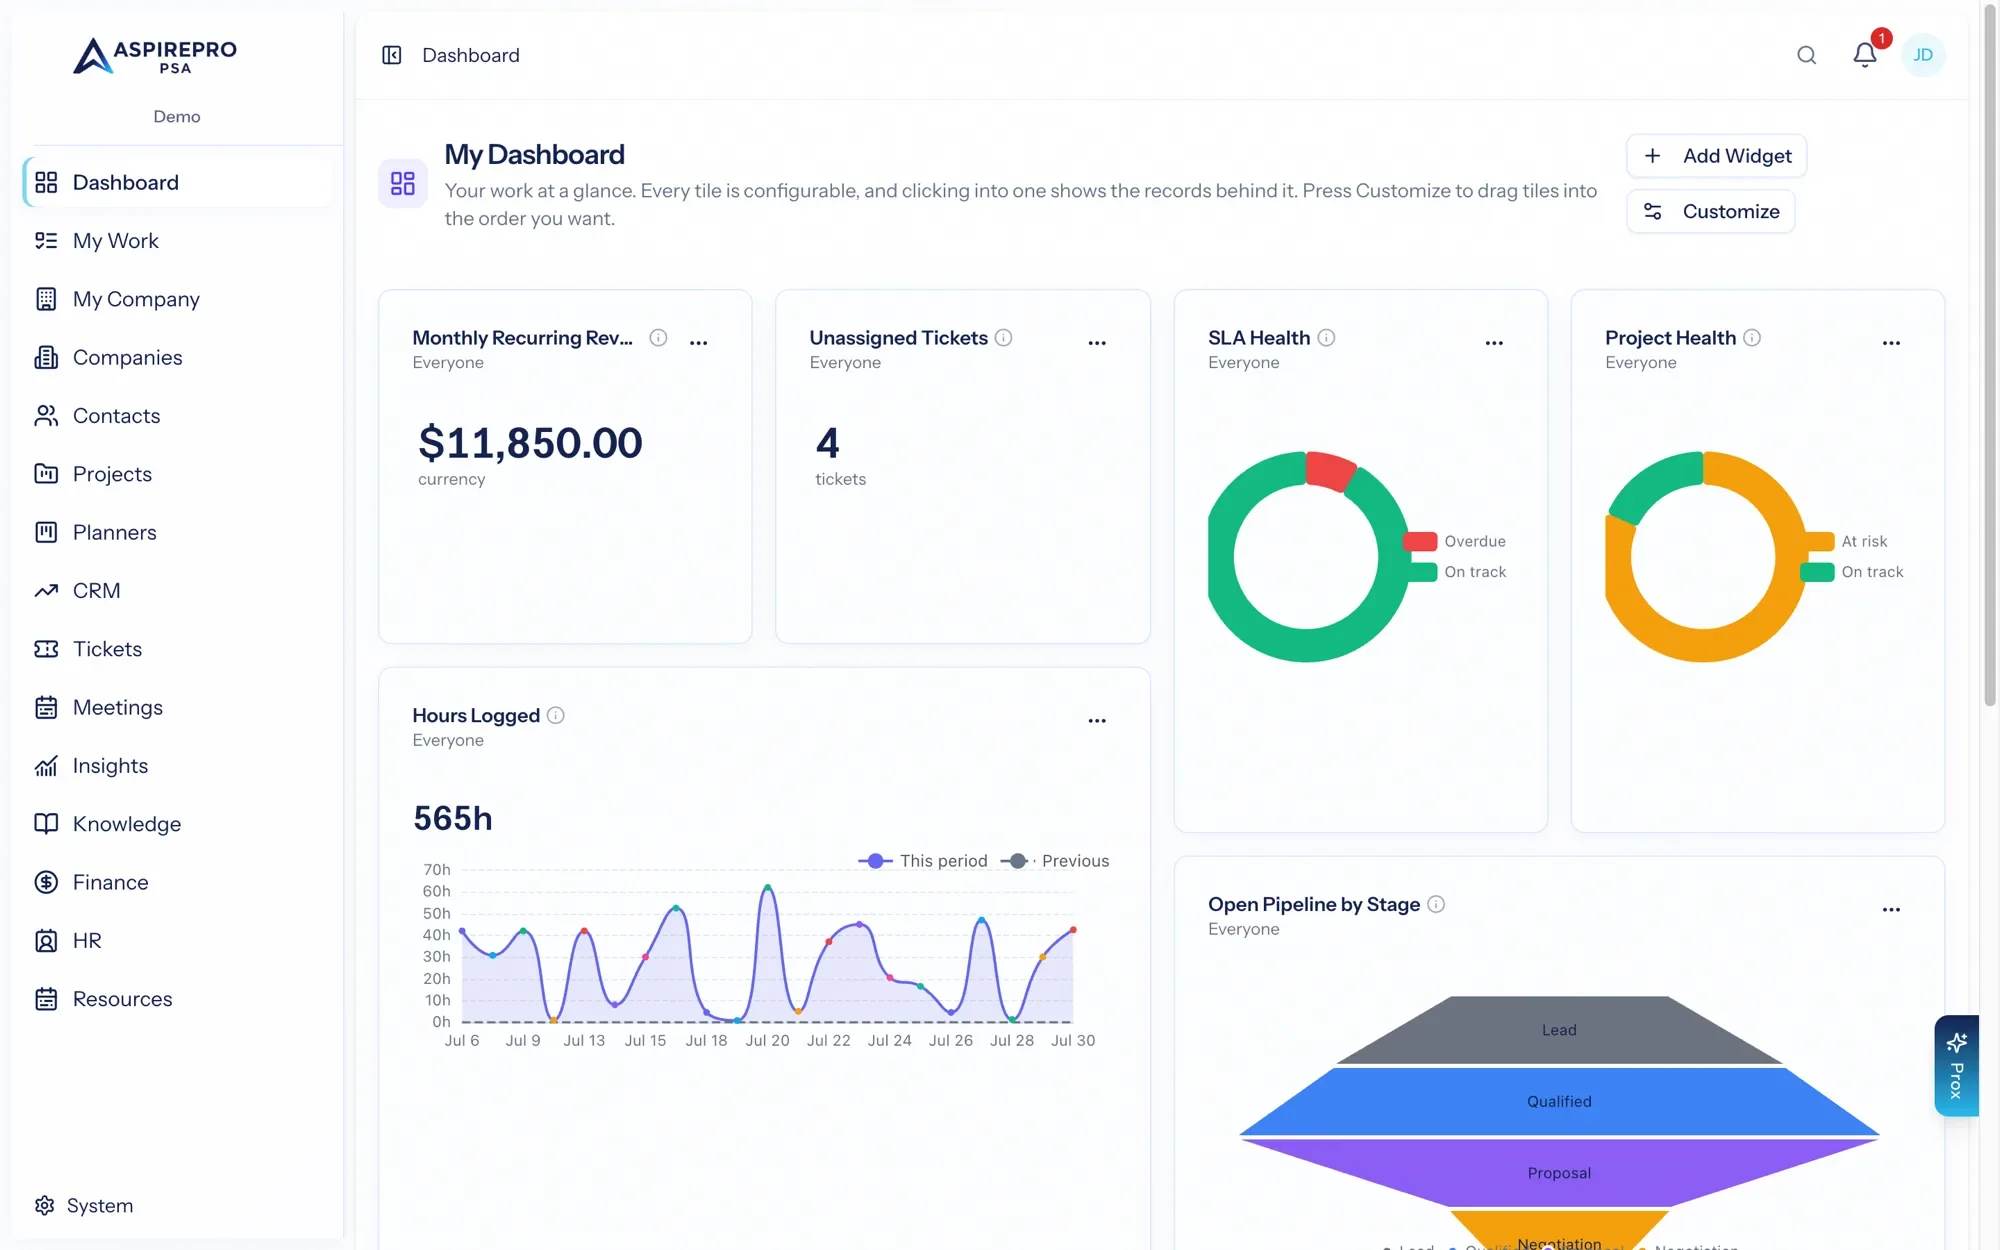
My Dashboard is the screen you land on when you sign in — your personal, at-a-glance view of the numbers that matter to you. It's built on AspirePro's metric engine (the same one behind the Insights module), so every tile shows live data, scoped to your permissions.
Widgets#
A dashboard is made of widgets — each one a metric shown as a number, a chart (bar, line, pie, donut, funnel, gauge), a trend, or a list. You choose which widgets to show and how they're laid out, so your dashboard reflects your role: a salesperson might feature pipeline value and deals by stage; a support lead, unassigned tickets and SLA health; a project manager, project health and hours logged.
Building your dashboard#
- Add a widget — pick a metric, choose a visualization, and give it a title.
- Configure it — many metrics accept parameters such as scope (just me / my team / everyone) and a date range (this week, this month, this quarter, and so on), so the same metric can answer different questions.
- Arrange — drag widgets to reorder and resize them into a layout that reads well.
- Drill in — click into a widget to see the underlying records behind the number.
- Remove widgets you don't need, or reset to the default layout to start fresh.
Live and permission-aware#
Every widget reflects the current state of your data the moment you load it — there's nothing to refresh manually. And because the metric engine enforces your permissions, a widget only ever counts records you're allowed to see; two people can have the same widget and correctly see different numbers.
Widgets also follow your organization's Features. When an administrator switches a module off — Tickets, say — its widgets leave every dashboard rather than sitting there as empty boxes, and they come back exactly as they were when the module is switched on again. A widget that needs two modules (meetings booked from tickets needs Tickets and the Scheduler) shows only while both are on.
My Dashboard vs. Insights#
My Dashboard is your personal dashboard — always on, just for you. The Insights module (when enabled) adds shared dashboards you can build for your team, schedule as reports, and share via links. The building blocks — metrics and widgets — are the same, so anything you learn here carries straight over. See the Insights module documentation.